

Summary:
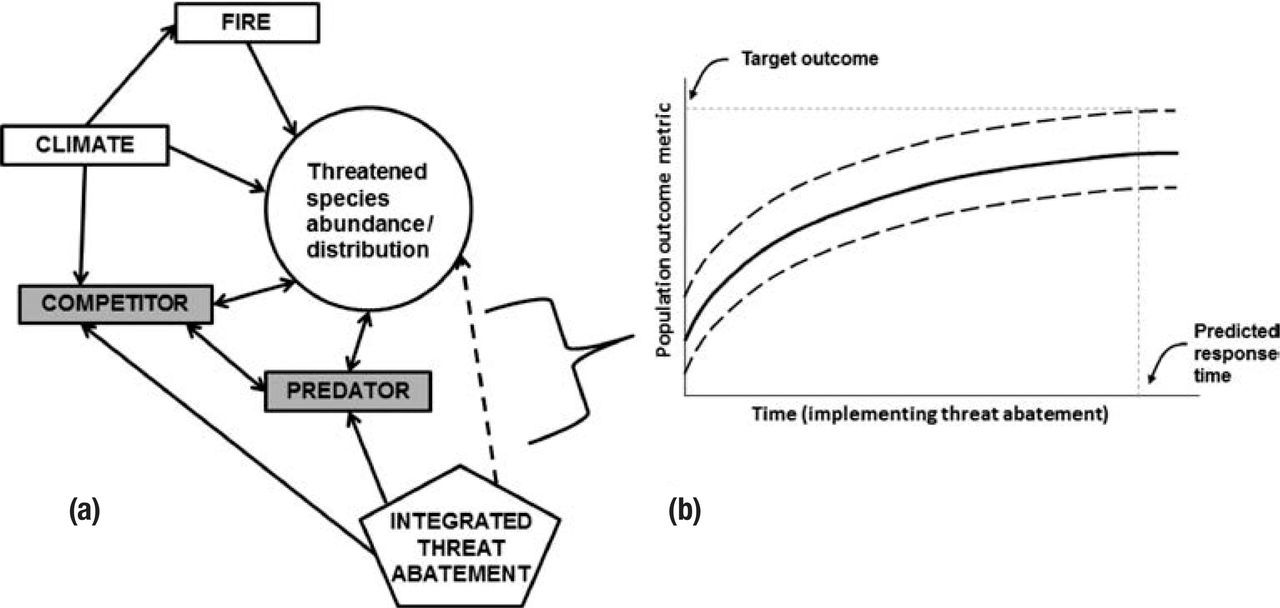
(a) Example of a quantitative conceptual model of a threatened species system and (b) the related model predicting population response to management. Shaded boxes represent managed threats; unshaded boxes represent unmanaged threats or drivers. The solid line in the plot on the right represents predicted change in some outcome metric (e.g. species abundance) over time in response to management; the broken lines represent the target confidence intervals or acceptable range of outcomes (i.e. control limits sensu Burgman et al. 2012).
Type:
Figure
Sub Component:
Normal
Slug:
F73
Highwire: Type:
fragment
Highwire: Parent:
HighWire: Journal/Corpus Code:
csirobk
Highwire: pisa_id:
csirobk;9781486307722/1/BK07720_ch17/F73
Highwire: pisa_master:
csirobk;9781486307722/1/BK07720_ch17/F73
HighWire: Atom Path:
/csirobk/9781486307722/9781486307722/SEC24/F73.atom
Highwire: cpath:
/content/9781486307722/9781486307722/SEC24/F73
Image - Large:
Highwire: cpathalias:
/content/csirobk/9781486307722/9781486307722/SEC24/F73
Image - Medium:
Highwire: Variants:
expansion
Image - Small:
Highwire: State:
Released
Contributors:
<atom:author xmlns:atom="http://www.w3.org/2005/Atom" xmlns:hwp="http://schema.highwire.org/Journal" xmlns:nlm="http://schema.highwire.org/NLM/Journal" hwp:inherited="yes" nlm:contrib-type="author"><atom:name>James Brazill-Boast</atom:name><nlm:name name-style="western" hwp:sortable="Brazill-Boast James"><nlm:surname>Brazill-Boast</nlm:surname><nlm:given-names>James</nlm:given-names></nlm:name></atom:author>
Last load event:
Wednesday, March 18, 2020 - 14:25