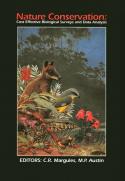
The proceedings of a Cost Effective Biological Surveys and Data Analysis workshop held at the old Quarantine Station, North Head, Sydney, in March 1988, under the auspices of the Council of Nature Conservation Ministers (CONCOM) and the Australian Environment Council (AEC).
- Page 3Abstract
A cost breakdown of three contemporary surveys that address study areas of very different sizes and complexities is presented. Their overall costs are related to costs of single species studies and the size of the budget of the Western Australian Department of Conservation and Land Management. There is an increasing demand for surveys but little chance of significant increases in staff and financial resources to pay for them. Thus, cost-effectiveness is now an important consideration during the planning and execution of surveys. Those planning surveys need to ensure that only those data required are collected and that costs are kept to a minimum.
- Page 7Abstract
The benefits of mapping are quantified and related to map scale. The primary benefit of mapping is the delineation of units which are more homogeneous in terms of physical attributes or species than the landscape at large. A secondary benefit is the representation of fine scale unmapped diversity, in this case species, by reserving examples of map units. Analyses of costs of soil and land use surveys in relation to map scale are reviewed and assumed to apply to vegetation mapping. Costs of reserving units at different scales are simulated. Cost-effectiveness curves for homogeneity/survey cost, species reserved/survey cost and species reserved/reservation cost all peak at coarse map scales and decline with finer scales. If the benefits of mapping are to be maximised then mapping and reserve selection are necessary at a relatively fine scale, despite low cost-effectiveness.
- Page 17Abstract
Three theoretical issues are discussed in the context of conservation surveys (1) community versus continuum, (2) the shape of species realized niches and (3) patterns of species richness. Community definition is dependent on landscape patterns but is useful for communication purposes within a region. The continuum concept applies to vegetation variation in relation to environmental gradients and is necessary for effective survey design. Realized niche shape may vary but accurate modelling is essential for predicting species distribution from survey data. No adequate theory exists for predicting areas of species richness, but empirical models have been successful and further development using survey data is needed.
- Page 23Abstract
Typically fauna surveys provide useful but relatively trivial information on the distribution and abundance of vertebrate fauna. Such surveys are also generally the first substantial ecological reconnaissance of an area. Too often they are seen as an end rather than as pathfinders for further ecological studies needed in the area. The challenge is to design fauna surveys which will provide the maximum return of useful information for a particular input of resources. In this paper, some generalizations which may increase the cost-effectiveness of fauna surveys are presented. The areas addressed include spatial sampling strategy emphasising gradients, sampling unnatural environmental impacts, getting the right scales for sampling, dealing with instability in faunal composition, the timing of sampling in relation to peak primary productivity, the organization of survey teams, taxonomic priorities and problems, the use of landscape context, the minimum of habitat information required, the interpretative value of floristics, problems for habitat assessment resulting from relationships between population density and habitat breadth, the identification of keystone plant resources, the identification of biologically meaningful units of land, the application of the right theoretical model and emergent information from sets of surveys.
- Page 31Abstract
Gradsect sampling, the deliberate selection of transects which contain the steepest environmental gradients with maximum access present in an area is reviewed as a design for broad-scale vegetation surveys. A gradsect procedure incorporating a detailed environmental stratification design for sampling vegetation within the gradsect is presented as a cost-effective method for obtaining a representative sample. An account is given of the use of this procedure on the North Coast of New South Wales to obtain a representative survey of the forest vegetation. The survey design is judged to be effective provided all major relevant environmental factors have been incorporated into the stratification and a suitable degree of replication has been used.
- Page 37Abstract
Vegetation data are expensive to collect. Existing data can often be used in place of new surveys e.g. herbarium records in conjunction with BIOCLIM. The amount of data collected at a site should be a function of travel time to the site, collection time and potential use of the individual data items. The cost-effectiveness of data items depends on extracting maximum information by use of data analysis techniques. Simple graphical methods can be as useful as elaborate multivariate methods. Many methods are effective provided some measure of the variability is incorporated into any results.
- Page 42Abstract
The analysis of animal survey data is reviewed. The main determinants of the type of analysis used are the study objectives and the frequency distribution of the data. Analyses usually attempt to determine differences between areas or times, and relationships between survey results and other factors such as environmental attributes. The most frequent analyses used in Australian Wildlife Research and the Journal of Wildlife Management from 1984 to 1987, inclusive, were Chi-square analysis, correlation and regression, Student’s t test and analysis of variance. The statistical and the ecological basis of the analyses are reviewed, stressing the need for ecologically relevant and simple analyses.
- Page 47Abstract
Pattern analysis can contribute to goals of conservation studies through their application at any stage from the planning of survey to the testing of hypotheses based upon survey data. The effectiveness of clustering and ordination depends upon matching the models and assumptions of the methods to the goals of the analysis. ‘Robust’ methods for analysis of community ecology data allow unwarranted assumptions about survey data to be avoided. They also cope with unavoidable weaknessess of survey data, including data noise and biases in sampling. The effectiveness of pattern analysis for conservation will also depend upon further development of hypothesis testing procedures to be used in conjunction with these methods. These tests will reflect null hypotheses ranging from: ‘could this community pattern have arisen by chance alone?’, to ‘does this community pattern implicate a particular environmental factor?’
Clustering serves a wide variety of roles in conservation studies. Robust methods help in detecting natural clusterings in survey data, but clustering methods can also impose cluster structure. A randomization test is illustrated that can be used to test for significant hierarchical structure In community data.
The wide applicability of ordination arises from its model of continuous environmental variation. Robust methods allow general unimodal relations between species abundance and environment, and statistical approaches provide powerful methods for interpreting and testing patterns in relation to environmental variation. The effective use of these procedures in conservation studies, however, depends upon the choice of assumptions at both the pattern analysis and hypothesis testing stages, as illustrated by two recent case studies.
- Page 54Abstract
The generalised framework for a wide class of regression models known as generalised linear models has direct application to survey design, analysis of survey data and as an integral part of the conservation evaluation process.
This generalised framework permits data as diverse as counts, frequencies, presence/absence data as well as continuous variables to be fitted to regression models that all have the same general form.
This paper provides a background to this development and describes the important differences between least squares linear regression models and the wider class of generalised linear regression models. A limited number of examples of the use of generalised linear models are described. In addition, an example of the application of a generalised linear model to the analysis of the environmental control of a forest eucalypt species on the Mid-north coast of New South Wales Is presented as a worked example. I describe the steps in defining the statistical aspects of the model, in selecting the predictor variables to be included in the model and discuss the need for critical evaluation of the final model and then how this model can be used to provide a prediction of the spatial distribution over the whole study area in a manner that could then be used as a basis for addressing conservation issues.
- Page 64Abstract
BIOCLIM is a bioclimate analysis and prediction system which can be used to stratify an area on a climatic basis prior to survey and also to predict distributions of individual entities such as species or vegetation types. BIOCLIM is based on continuous mathematical surfaces fitted to measured meteorological data, and can be used to generate estimates of monthly mean minimum and maximum temperatures and precipitation for any point on or near mainland Australia and Tasmania, from inputs of latitude, longitude and elevation.
Climatic stratification of survey areas can be based on any attribute derivable from monthly mean values, such as mean annual temperature or mean winter precipitation. The most generally useful procedure would be to lay out a regular grid, then use a contouring package to provide isotherms/isohyets, which could form the basis of the stratification.
Predictions of entity distributions can be made at a variety of scales and resolutions. Climate estimates from points on an arbitrary grid in a survey area can be matched against an entity’s climate profile, the latter encompassing climate estimates from individual sites where the entity has been recorded. Differing degrees of correspondence between the grid points and the profile can be used to provide different levels of prediction in various parts of the survey area. In addition, predictions from a number of entities can be combined in order to highlight regions potentially containing high biological diversity.
- Page 69Abstract
In designing a monitoring program several sets of decisions must be made.
The objectives of the monitoring must be determined and expressed in terms that can be measured. This will necessarily require interaction with the decision makers who are to use the monitored information.
The monitoring options must be determined and their effectiveness assessed with respect to overall objectives. In most cases, effort expended in designing and setting up a monitoring programme can reduce the subsequent costs of recurrent surveys.
The cost of the monitoring programme has to be balanced against the cost of failure to achieve the stated objectives. Attempting to achieve 100% success rate (or precision) in each survey is unlikely to be justified. Some simple economic models are presented, relating the penalty costs of failure of the monitoring program to the costs of setting up and of repeated survey.
- Page 74Abstract
Geographic Information Systems (GIS) have a significant inventory support role which includes 1) the design and selection of sampling strategies; 2) the modelling and mapping of species distributions in terms of known or surveyed environmental variables; and 3) the systematic use of this information for decision making purposes. The task of recommending a proposed system of conservation reserves based on species distribution data can be set up as a mixed integer goal programming problem with constraints which penalise failure to include a species, but which do not penalise multiple representation. Some commercially available GISs and mapping packages are reviewed.
- Page 83Abstract
Cost effective surveys for the conservation of non-economic species depend upon setting priorities for species after evaluation of existing land status. Some case studies from Tasmania will be used as a basis for discussion. The conservation status of most species gives them a high chance of long-term survival. The identification of this status only requires reasonable criteria for reservation and a modicum of observation and data assembly, tempered with a knowledge of conservation ecology. Inadequately conserved species may not be susceptible to conservation through reservation. Some may require both reservation and management. A procedure for identifying species and their reservation requirements is described.
- Page 90Abstract
A method for selecting a network of reserves to encompass maximum biotic diversity is described and illustrated with examples of wetlands from the Macleay Valley floodplain and remnant vegetation patches on the western Eyre Peninsula. A comparison with multivariate scoring and ranking selection procedures, using land system data from the semi-arid rangelands of the Western Division of New South Wales, shows that scoring and ranking procedures are much less efficient in that much more of the land area is needed if all land systems are to be represented in the reserve network.
- Page 98Abstract
Land acquired by the National Parks and Wildlife Service occupies 2.9% of the Western Division but does not contain a representative sample of its natural environments. Additional reserves are necessary to represent all environments. A stepwise procedure for reserve selection has been applied as a trial for the northern part of the region. The procedure samples all the natural attributes recorded, in this case land systems, in a relatively small number and extent of nominal reserves. Nearly 6% of the study area was required for at least one representation of each land system, ignoring existing reserves. With existing reserves, over 8% was needed to achieve one representation. Proposed refinements of the analysis are discussed.
- Page 109Abstract
This paper explains and examines a quadrat-based sampling strategy using the Nullarbor region of Australia as an example. The strategy was developed to provide the data needed to guide nature conservation decisions at regional scales. The presence/absence of bird, reptile, mammal and plant species was recorded during two seasons on each of 80 quadrats. The quadrats were positioned across the 20,000,000 hectare study area according to a random pattern, stratified using 1:250,000 maps of surficial geology. The computer package PATN was used to analyse the data. The result is a quantitative database that can be analysed to:
Expose geographic patterns in the species composition of assemblages for a wide variety of the organisms that constitute a regional biota.
Characterise these biological patterns in terms of scalars of the physical environment such as substrate and climate.
Provide a basis for long-term monitoring of regional management strategies. Needs for further research into the sampling design are identified.
- Page 127Abstract
The background, data and results of a survey to determine the distributions of arboreal mammals in the Eden (New South Wales) forests utilised for export woodchip harvesting are summarised and discussed.
The survey used data provided by logging crews on numbers of 8 species of arboreal mammal that they found during logging operations. The mammals were the greater glider (Petauroides volans), feathertail glider (Acrobates pygmaeus), sugar glider (Petaurus breviceps), yellow-bellied glider (P. australis), brushtail possum (Trichosurus vulpecula), ringtail possum (Pseudocheirus peregrinus), pigmy possum (Cercartetus nanus) and squirrel glider (Petaurus norfolcerisis).
Environmental measures recorded at each logging site included vegetation composition and structure, indices of leaf nutrient concentration and geological substrate.
The survey showed a high degree of patchiness in the distribution of animals; 63% of the number of animals found by the falling crews were reported from 9% of the area of forest felled.
A forest fertility factor was the priority determinant of animal distributions. Most animals reported were from forests of eucalypt species with high concentrations of nutrients in their leaves, which occur on the most fertile geological substrate in the Eden Region, a granite known as Devonian Intrusive.
The survey methods used were opportunist and destructive of habitat and fauna. However in other respects, the survey was both highly cost efficient and successful. Alternative non-destructive methods such as spotlighting are feasible but require substantial personpower, logistics and funding.
Four main factors contributed to the success of the survey: 1) sufficient community concern to cause industry and government interests to request CSIRO to implement research; 2) the assistance and collaboration of staff of the Forestry Commission of New South Wales and of the logging crews in the forests; 3) the survey’s wide geographic extent which resulted in the collection of data from a broad spectrum of forest environments; 4) the intellectual input and co-operation of a multi-disciplinary group of scientists.
- Page 134Abstract
A floristic vegetation survey of the Victorian Mallee was carried out between September 1985 and December 1987. The survey area covered approximately 43 000 km2, of which approximately 16500 km2 is public land with native vegetation.
The main purposes of the study was to provide the Victorian Land Conservation Council with floristic information upon which to base decisions on land use and to create a database for use by regional management staff of the Department of Conservation, Forests and Lands (now Conservation and Environment) in their conservation and land management programmes.
The study area was sampled by a total of 1284 quadrats, each 30m in diameter. Analysis of these data, using conventional, numerical classification techniques, described 100 recognisable vegetation units (sub-communities) which were grouped into 30 communities. These communities were mapped, with the aid of black-and-white and colour aerial photography and extensive field checking, at a scale of 1:100000 and 1:250 000.
It is concluded that the development of techniques to link remote-sensing digital image analysis with the numerical classification of raw quadrat data has potential to improve the quality of vegetation mapping and monitoring, and that computer-based geographic information systems, which incorporate high quality graphic outputs, can add considerably to the flexibility of map production and interpretation. However, it is also concluded that vegetation survey, by its nature, is a labour-intensive discipline and that the effective use of survey staff is the most significant area in which costs can be minimised.
- Page 142Abstract
A vegetation and vertebrate survey was carried out in the Gawler Ranges in October 1985, and a vegetation survey of the southern Mt. Lofty Ranges between March and May 1986. These surveys are described following a series of seventeen stages beginning with understanding the reasons for conducting the survey and ending with attempts to implement the survey recommendations. Both money and time costings for the two surveys are tabulated and the very large commitment of time that is necessary post-survey is highlighted.
- Page 148Abstract
Data collection by skilled non-professional biologists has been used successfully in Australia for a number of Atlassing projects but the use of observations collected in this manner to define species communities is largely untested. The Biological Records Scheme of the Northern Territory was used in this study to define the bird communities for the hinterland of the south-west corner of the Gulf of Carpentaria. Twenty observers contributed a total of 3871 sightings of 252 bird species and these data were analysed by classification and ordination techniques. The bird associations defined were meaningful and reflected regional environmental gradients. This study demonstrates that publicly contributed information on the presence/absence of species can be confidently used to increase the sampling effectiveness of conservation surveys.
- Page 159Abstract
ECOSIM is an interactive tool for testing various biological sampling strategies that would not normally be possible with fieldwork. Extensive flora and fauna surveys in the southeast of NSW form the database on which the computer simulation was based. Modelling of the geographic distribution of a range of plants and animals on environmental features enabled the interpolation of data from the survey sites to other regions in the area. While some ‘rationalization’ of the real environment was necessary, the simulation produced realistic results and highlighted gaps in process knowledge of the biology and environmental factors in the region.
- Page 167Abstract
Five sampling strategies are compared in terms of the number of species recorded and the cost incurred, using the simulated data set for the Southern Fablelands (Belbin and Austin, Chap. 21). The strategies are:
Random sampling;
Systematic sampling;
Transect sampling;
‘Informed’ sampling —where some knowledge of the ecological relationships in the area are employed;
Gradient directed transect, or gradsect, sampling.
The sampling strategies were also compared with the results obtained by the study groups using the simulation exercise in the Workshop itself.
Gradient directed sampling proved to be the most effective strategy in terms of costs and number of species recorded unless there was prior knowledge of the ecology of the study area. This is not usually the case before a survey has been carried out.
- Page 176Abstract
This paper gives a step by step example of a Pattern Analysis of vegetation data. The data used resulted from a simulated survey exercise by a group of workshop participants using ECOSIM, a program to simulate an ecological survey. Each stage of the analysis, using the PATN package, is detailed and the results presented.
- Page 191Abstract
An introduction to statistical modelling of binary data is presented using the statistical computer program known as Generalised Linear Interactive Modelling (GLIM). The paper provides a step-by-step introduction to GLIM using a small representative data set. The reader is shown how to read, display (both graphically and in tables) and fit a logistic model to these data with examples of the GLIM code and GLIM oulput presented. In addition some guidance is given on the important question of model evaluation and examination of the residuals.


